
I have been meaning to write about this topic for a while, and now I have Nancy Pelosi and Donald Trump to thank for spurring me to doing so. In case you missed it (or you’ve forgotten because the news moves so quickly), last week Pelosi said that she would rather Trump refrain from taking hydroxychloroquine as a prophylactic against COVID-19, which he said he had been doing for more than a week. Pelosi’s comments revolved around the lack of scientific evidence of the drug’s efficacy, and that fact that it appears to be harmful. Her apparent concern was followed by some not very subtle backhanded comments, adding that Trump was at heightened risk for drug complications due to: “his age group and in his, shall we say, weight group – morbidly obese, they say. So, I think it’s not a good idea.”
Weight is a sensitive topic. Pelosi’s comments were seen by some as justified comeuppance, since Trump has an expansive history of insulting others, but they were more widely panned as fat-shaming. Still others, such as CNN Political reporter Chris Cillizza, wondered whether Trump really was in fact “morbidly obese” by looking at CDC guidelines on the body mass index (BMI).
There are certainly more important things going on in the world right now than worrying about weight or BMI. Still, there is some evidence that people in developed countries under lockdown are gaining weight – the so-called “quarantine 15” – while people in lower-income countries are at higher risk for famine. As someone who has used BMI in research, I’d like to focus on its uses and some of its shortcomings, as well as the potential stigmatizing effects of labeling people by BMI categories.
BMI is used by an array of health professionals – physicians, nutritionists, epidemiologists, humanitarian aid workers – as a screening tool for people who might be under- or over-weight, acting as a warning of potential health problems. One of the reasons BMI is so widely used is its simplicity. All you need are two measurements: height (in meters) and weight (in kilograms), which are then plugged into the formula kg/ m2. And, unlike other more direct ways of assessing body composition, such as skinfolds, dual-energy x-ray absorptiometry, or underwater weighing, BMI can be ascertained with just a scale and a stadiometer. This makes BMI a method that is cheap, while requiring minimal training. This also makes BMI a portable, field-friendly method for researchers (including biological anthropologists) working with people who live in a range of environments.
Categorizing People by BMI
A higher BMI is suggestive of higher body fat, which is a risk factor for various morbidities including type 2 diabetes and cardiovascular diseases. For that reason, health organizations such as the CDC use rough categories to ascertain who might be at risk for elevated body fat (or adiposity). In adults, “absolute” cutoffs for categorizing adults are recommended:
- Underweight – 18.5 kg/m2
- Normal or healthy – 18.5 to 24.9 kg/m2
- Overweight – 25.0 to 29.9 kg/m2
- Obese – 30 kg/m2 or higher
- Class 1 Obesity – 30 to 34.9 kg/m2 or higher
- Class 2 Obesity – 35 to 39.9 kg/m2 or higher
- Class 3 Obesity – 40 kg/m2 or higher
If you know your height and weight, there are simple ways of finding your BMI if you don’t have a calculator handy, such as this site. Or, you may have seen a chart like this before.

For children, it’s a little trickier. Whereas adults have absolute thresholds for BMI, those same numbers don’t match up very well for children, because BMI changes as we grow. As a result, children have “relative cutoffs” and are compared to percentiles for their age- and sex-matched peers. In the U.S. these are set at the 85th percentile for overweight and the 95th percentile for obesity (more on this later).
Some Problems with BMI: A Partial List
Assuming you are an adult reading this, and you’ve found your BMI, consider not putting too much stock into this number. It is true that, on average, a higher BMI is correlated with higher body fat and other health issues. However, this is an imperfect correlation, and BMI has several shortcomings. I have a lot of problems with BMI, and now you’re gonna hear about it. Well, at least some of them. You can find more examples elsewhere.

RIP, Jerry Stiller.
The first problem with BMI is that people often forget that it is supposed to be just a screening tool. In theory, it is not diagnostic by itself. To return to Donald Trump, his BMI categorization probably isn’t as important as his other health metrics, which remain a mystery since he has not yet completed the physical exam he started months ago. In practice, unfortunately, BMI is sometimes treated as the final word. And many people can internalize their BMI categorization as a measure of self-worth, which of course is not what it’s supposed to be.
Not all researchers use BMI as a screening tool for individual health status. Biological anthropologists, for example, tend to use BMI as descriptive, such as comparing averages between populations. Generally speaking, there is less at stake to say that sample X has a higher average BMI than sample Y, or that the sample X’s average BMI has changed over time, than to label an individual as clinically underweight or overweight based on their height and weight.
For example, hunter-gatherer populations are sometimes imagined as living precariously, constantly teetering at the edge of starvation. In a review of several hunter-gatherer populations, Mark Jenike (2001) showed that this probably was not the case, as most had average BMI’s in the “normal” range, above the line of 18.5 kg/m2designated as “underweight.” This comparative approach is where an index like BMI has value. It also helps to remember that populations and individuals are different levels of analysis.
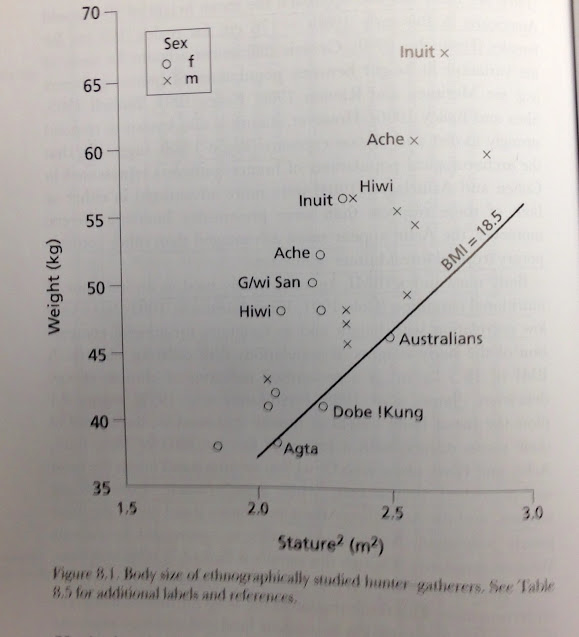
Average BMI’s of several hunter-gatherer populations, illustrating that most were above the line designated as “underweight” (from Jenike 2001).
The second problem with BMI categorizations, in my view, is that it takes a continuous variable and breaks it up into discrete categories. As a thought experiment, imagine three people: one with a BMI of 18.6 kg/m2, another 24.9, and a third being 25.1. The first two people would be placed in the same category, at the low and high ends of “normal.” Yet individuals 2 and 3 in this example are really close to each other (24.9 vs 25.1), although in this system of cutoffs they are viewed as categorically different. This problem isn’t limited to BMI, nor is this necessarily fatal to BMI. It’s simply a reminder that chopping up continuous variables into discrete blocks carries with it some limitations. The same applies to grading students, for example.
A related, third problem is that these aren’t just discrete categories, but ones that strongly hint at round-number bias, with thresholds that happen to end in 0’s and 5’s (25, 30, 35, 40). I mean, what are the chances that something biologically meaningful would happen to coincide consistently with such neat and clean breaks? As an aside, this reminds me of George Carlin’s take on the Ten Commandments: “Why not 9? Or 11?… I’ll tell you why. Because ten sounds important… Ten is the basis for the decimal system. It’s a decade. It’s a psychologically satisfying number.” So perhaps we’re more receptive to round numbers and multiples of ten (or, in the case of 5, numbers that are halfway to ten).
It wasn’t always this way. The BMI thresholds for overweight changed in 1998 , before which they used to be 27 for men and 28 for women. In the case of relative cutoffs for children, something similar occurs by using the 85th and 95th percentiles. But not all countries use these cutoffs. In the 1990s, Belgium and the Netherlands used the 97th percentile, while Finland, Greece and France have used the 90th, and Australia the 85th (Guillaume 1999). For relative cutoffs in children, another problem is what reference data we’re using for comparison, as these can yield very different results.
Problem #4. Many people have noted that weight is a very imperfect assessment of body fat, so having higher BMI is not a guarantee of elevated adiposity. The obvious example is that athletes with higher muscle mass often have higher BMI’s. In one study of NFL football players (Harp and Hecht, 2005), it was found that 97% were at least overweight (BMI of 25-29.9 kg/m2), while 56% crossed the threshold for obesity (a BMI of > 30 kg/m2). The authors warned that additional measures of body composition should be taken beyond weight alone, but they also concluded that “the high prevalence of obesity in this group warrants further investigation to determine the short- and long-term health consequences of excessive weight in professional as well as amateur athletes.”
The case of applying BMI to NFL players is instructive. These are extreme athletes, and by definition not very representative of the wider population. For them, BMI likely produces “false positive” categorizations of overweight and obesity. The converse can also be true. People can be “false negatives” with normal BMI but have a relatively high body fat percentage, a so-called “thin-but-fat” phenotype (Kurpad et al 2011; Yajnik 2004). In a 2004 paper, obesity researchers Chittaranjan Yajnik and John Yudkin discussed what they called the “Y-Y paradox,” cleverly named after themselves. Both had the same BMI, but one (Yajnik) had a higher body fat percentage, ascertained by dual X-ray absorptiometry (Yajnik and Yudkin 2004). They speculated on whether an adverse prenatal environment might predispose some people (in this case, focusing on India) to retain body fat in preparation for future nutritional hardship. This might lead to a higher body fat percentage for a given BMI.

Chittaranjan Yajnik and John Yudkin, demonstrating the “Y-Y paradox.” Both had the same BMI, but different body fat percentages.
Sorry to bring in another comedian reference, but an old Norm MacDonald story fits here:
“I had to go to this doctor, and he gives me like — he always gives me crazy things. And so he said, ‘I want to test out your body fat.’ Meanwhile, I’m a really skinny guy. Like, my whole life I’ve been skinny…I say, ‘I don’t need no body fat thing, man. I’m a really skinny guy.’ So he puts these calipers on, you know? He tests me out and he comes back. It turns out, I’m fat as well as skinny!”
[Note: I’m not really sorry. Norm MacDonald is not for everyone, but I like him. It’s a good story].
So, yes, it’s possible to be “skinny” and “fat” simultaneously. It’s also possible to be heavy and fit. And that gets to Problem 5, which is the heart of the matter. The important thing to focus on as individuals is health, as opposed to a number and our BMI categorization, as this is limited in what it reveals about our individual body composition and health.
Problem 6: Human variation. Long ago, I did a study on the growth of Hmong children in the U.S. (Clarkin 2005). In a nutshell, I found that BMI yielded higher estimates of overweight and obesity than did other methods, such as skinfolds and bioelectric impedance analysis. Similarly, in a literature review of child obesity studies, Dietz and Bellizzi (1999) found that Pearson correlations between BMI and other measures of body fat ranged from 0.44 to 0.87. These are moderate to strong correlations, but far from perfect. There are many potential reasons for this discordance, but one complicating factor could be human variation in body shape and proportions. The kids in my sample were a bit shorter than average, with a median z-score of about -1z.
A few other studies from the time found that BMI overestimated obesity among shorter children, particularly in developing countries, as they may have elevated BMIs but relatively low triceps skinfolds. Why should this be? Shorter people tend to have proportionately more of their height in their “trunk” or torso (as well as neck and head) than in their legs. And you’ve probably noticed that not all our body parts that contribute to our height are equally dense. The torso is just chuck-full of fleshy humanness, unless you have a cannonball wound.

Using birds (a penguin and a crane) to help illustrate extreme differences in leg length as a proportion of total height. For humans, having proportionately longer legs tends to decrease BMI. Having shorter legs has the opposite effect. Note: I have no idea if ornithologists have obesity standards for birds.
On the other hand, legs have empty space between them that contribute to our height but nothing to weight. It’s just air. To put it another way, imagine two people who are about the same height but with extremely different body proportions. Go ahead. Imagine it! The first has extremely short legs, almost penguin-like, while the second is extremely long-legged, sort of crane-like. All else being equal, a crane-shaped person would have a lower BMI in part because of their long leggedness contributing to height, but very little to weight. Obviously, those extreme bird proportions don’t occur in people, but there is variation around the world in this torso-to-leg ratio, known as the sitting height ratio, or Cormic Index (another index!), and this indeed has an effect on BMI. So, if you’re comparing someone with relatively short or long legs to a sample of people with average legs, all things are not equal, and your estimates of overweight and obesity can be skewed.
Problem 7: Vocabulary and stigma. In 1998, after the National Institutes of Health downshifted its overweight threshold to a BMI of 25, the New York Times published an article describing the changes with this headline: “U.S. to Widen Its Definition of Who Is Fat.” A popular meme addresses this tendency to equate weight status with one’s entire identity: “You are not fat. You have fat. You also have fingernails, but you are not fingernails.” That distinction is important. Language matters.
This brings us back to Pelosi’s comments on Trump, in particular referring to his weight group as “morbidly obese.” While the word “obese” itself has a clinical usage, it is also loaded with baggage and stigma. And, adding the descriptor “morbid” conjures additional mental images, since the word is synonymous not just with “unhealthy” but also with “ghoulish” or “gruesome.” For these reasons, some researchers have tried to reframe our terminology. Instead of referring to “the obese” or “who is fat,” we can try using “people with obesity” (emphasis on “people”). This isn’t trivial. Kersbergen and Robinson (2019) found that in the UK, US, and India, there is a tendency to think of people with obesity as less than fully human. That is tragic.
Research shows that biases against people with obesity is widespread, even among health professionals. One UK study of 1,000+ students who were training as dieticians, nutritionists, nurses, and physicians had high rates of bias, with only 1.4% of participants expressing “positive or neutral attitudes” toward people with obesity (Swift et al, 2013). Lower levels of “fat phobia” were seen among students who themselves had higher BMIs, who were studying to be nurses, and who had stronger perception that obesity is not under a person’s control.
And that says quite a lot, doesn’t it? So much of the discussion about obesity revolves around a subtext of moralizing about a person’s character and control. Why does someone have obesity? Is it the choices they made? Were they bad choices? Are they bad people? Nope! Well, maybe. They could be bad people, but it wouldn’t be related to their BMI. I have many problems with Donald Trump, but his weight isn’t one of them.
Anthony Rodgers et al (2018) addressed the issue of control in a review of the increasing prevalence of obesity in the US over time. Because the uptick in obesity rates started to increase in almost all subgroups in the late 1970s, they argued that: “We believe it is implausible that each age, sex and ethnic group, with massive differences in life experience and attitudes, had a simultaneous decline in willpower related to healthy nutrition or exercise.” In other words, this was about more than individual choices people were making.

Prevalence of obesity in the US over time, by age and sex (Rodgers et al 2018).
All of this is a long-winded way of saying that BMI is imperfect. Dietz and Bellizzi concluded that BMI offered a “reasonable” assessment of body fat, while Neeland and de Lemos JA (2016) wrote that it might be time to retire it altogether, in favor of other measures such as abdominal fat. Our desire to quantify is probably a good thing, as long as we remember the nuances and limitations of our measurements, as well as the importance of prioritizing people’s humanity above numbers.
References
Clarkin PF. 2005. Methodological issues in the anthropometric assessment of Hmong children in the United States. American Journal of Human Biology 17(6): 787-795. Link
Dietz WH, Bellizzi MC. 1999. Introduction: the use of body mass index to assess obesity in children. American Journal of Clinical Nutrition 70 (suppl.): 123S-125S. Link
Guillaume M. 1999. Defining obesity in childhood: current practice. American Journal of Clinical Nutrition 70 (suppl.): 126S-130S. Link
Harp JB, Hecht L. 2005. Obesity in the NFL. JAMA 293 (9): 1061-2. Link
Jenike M. 2001. Nutritional ecology: diet, physical activity and body size, In C. Panter-Brick, RH Layton and P Rowley-Conwy (eds) Hunter-gatherers: An interdisciplinary perspective. Cambridge Univ Press. Link
Kersbergen I, Robinson E. 2019. Blatant dehumanization of people with obesity. Obesity. 27(6): 1005-12. Link
Kurpad AV, Varadharajan KS, Aeberli I. 2011. The thin-fat phenotype and global metabolic disease risk. Current Opinion in Clinical Nutrition & Metabolic Care. 14(6):542-7. Link
Must A, Dallal GE, Dietz WH. 1991. Reference data for obesity: 85th and 95th percentiles of body mass index (wt/ht2) and triceps skinfold thickness. American Journal of Clinical Nutrition. 53(4):839-46. Link
Neeland IJ, de Lemos JA. 2016. Time to retire the BMI?: evaluating abdominal adipose tissue imaging as novel cardiovascular risk biomarker. Journal of the American College of Cardiology 68(14): 1522-4. Link
Rodgers A, Woodward A, Swinburn B, Dietz WH. 2018. Prevalence trends tell us what did not precipitate the US obesity epidemic. The Lancet Public Health. 3(4):e162-3. Link
Swift JA, Hanlon S, El‐Redy L, Puhl RM, Glazebrook C. 2013. Weight bias among UK trainee dietitians, doctors, nurses and nutritionists. Journal of Human Nutrition and Dietetics. 26(4):395-402. Link
Yajnik CS. 2004. Obesity epidemic in India: intrauterine origins?. Proceedings of the Nutrition Society. 63(3):387-96. Link
Yajnik CS, Yudkin JS. 2004. The YY paradox. The Lancet. 363(9403):163. Link
